


 Listen to the article
In Hyderabad, housing units were sold at a rate of 14,693 in the first half of 2022 as opposed to 11,974 in the first half of 2021, according to research by Knight Frank India called India Real Estate.
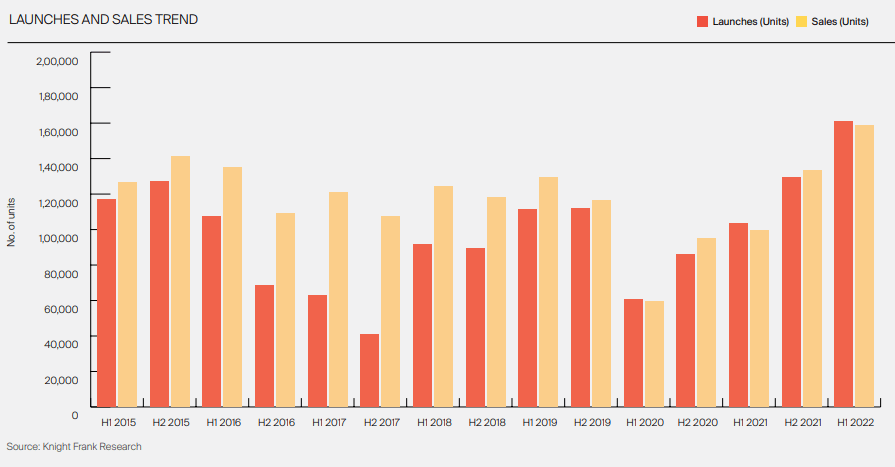
The Indian residential market suffered because of the pandemic needs in H1 2020 and H1 2021. However, this influence has been progressively fading as sales volumes are on the verge of reaching a six-year high. A total of 160,806 units, or a 56 percent YoY increase, were introduced in the first half of 2021. The percentage of sales in the INR 10 million and above ticket size increased considerably to 25% in H1 2022 compared to 20% a year earlier, continuing the rising trend witnessed in the previous three months. It can get linked to the homebuyers’ desire to move to larger homes with more facilities. Also, the fact that pandemic-induced income interruptions did not negatively impact higher income categories may have contributed to this rising trend.
The number of unsold inventories decreased somewhat from the 440,117 units in H1 2021. Nevertheless, it was becoming more common for developers to provide higher value additions, such as more completed or furnished apartments, especially near the end of H1 2022. QTS reveals the number of quarters necessary to exhaust the unsold inventory.
Even while home loan interest rates are currently lower than before the pandemic, it is important to assess how each increase in the rate would affect the EMI burden and eventual affordability levels for end users.
Hyderabad Real Estate Market in H1 of 2022
The sale of housing units increased by 23 percent in Hyderabad between January and June 2022 compared to the same period the previous year, marking the most notable growth rate in the prior 11 years.
In Hyderabad, housing units were sold at a rate of 14,693 in the first half of 2022 as opposed to 11,974 in the first half of 2021, according to research by Knight Frank India called India Real Estate.
In Hyderabad, homes are often get owned by IT workers. Throughout Covid-19, they had no issues. They were essential in maintaining the city’s real estate market’s stability. Houses can no longer be purchased for a bargain in Hyderabad. Many customers and investors now like it as a travel destination.
According to the survey, the cost of a livable home rose by 4.2% in the first half of 2022.
Additionally, the IT sector boosted Hyderabad’s office space sales, demonstrating the business community’s continued trust in Hyderabad as a prime investment destination. According to the research, transactions for office space totaled 0.8 million square feet in the first half of 2021 and 1.2 million in the same period of 2022.
Transactions in the office sector increased by 101% to 3.2 million square feet this time from 1.60 million square feet the previous year. The area of brand-new offices is 5.3 million square feet. Share transactions in the banking, financial services, and insurance sectors climbed by 12%.
Also Read: Ultimate Guide for Hyderabad Real Estate Investment
Ahmedabad Real Estate Market in H1 of 2022
When the COVID epidemic struck in H1 2020, home sales volumes in Ahmedabad fell by 69 percent YoY, having a profound effect on the city’s real estate market. Though the second wave was more severe in terms of infection frequency and mortality rate, the market has
since slowly recovered. Despite the Omicron variation earlier this year, this recovery has only intensified in the first half of 2022.
Sales of new homes in the Republic of Ireland rose by 95 percent YoY to 8,197 units in H1 2022, driven by cheap housing costs and a resurging desire for home ownership. 10,385 units were introduced in the first half of 2022, representing a 67 percent increase YoY increase. During H1 2022, homeowners and investors continued to choose planned developments in gated communities. The demand for tickets priced between INR 5 and 10 million has changed significantly over the previous few years. It is because of the necessity to modernize the family’s principal dwelling and to satisfy the criteria for work and education from home.
Despite rising input costs, developers have been watchful not to hike prices in Ahmedabad since the city has a history of being a price-sensitive market. Over the previous six years, the average age of inventory has continually decreased, indicating an increase in the consumption of ready inventory. Even with the limited price reduction for properties that are still under construction, working with unproven developers in less-than-ideal areas is still risky.
In H1 2022, the market had a modest 2.8 percent YoY growth in average prices. This market is the least expensive in terms of price per square foot among the eight areas we are reviewing, which results in thinner margins for developers. Although the prospect of increased demand is positive for the market, heightened inflationary expectations and rising interest rates might impede market momentum.
| Parameter | 2021 | 2021 Change (YoY) | H1 2022 | H1 2022 Change (YoY) | Q2 2022 | Q2 2022 Change (QoQ) |
| Launches (housing units) | 14,648 | 99% | 10,385 | 67% | 5,428 | 10% |
| Sales (housing units) | 8,911 | 37% | 8,197 | 95% | 4,092 | 0% |
| The average price is INR/sq m (INR/sq ft) | INR 30,139 (INR 2,800) | 0% | INR 31,000 (INR 2,880) | 2.8% | – | – |
Source: Knight Frank
Bengaluru Real Estate Market in H1 of 2022
Early in 2022, the Omicron wave had little effect on Bengaluru’s residential sector, which saw robust sales and launch numbers. In Bengaluru, 21,223 new residential units got introduced, a 59 percent increase over the same time last year. One of the greatest supplies since 2016 was recorded in H1 2022. The rapid increase in new product releases suggests that developer confidence is growing and consumer attitude is steadily improving.
Residential sales in the city increased by 80% in the first half of 2022, helped in part by a low base. South Bengaluru, an established cluster comprising some major commercial and economic areas, accounted for 38% of the total sales. The need for housing in Bengaluru gets driven by rising income levels inside the information technology field and the persistent expansion of startups and unicorns.
South Bengaluru is still the most popular area, accounting for 51 percent of all debuts in H1 2022. Some of the most significant Grade A and Grade B debuts, mostly in the mid-and luxury segment, were drawn to remote extremities on Sarjapur and Kanakpura Road. Another area in Bengaluru where homes are in high demand is East Bengaluru. Whitefield and the neighboring districts will now have a better connection thanks to the purple line metro rail, which gets anticipated to begin service in December 2022.
In recent years, North Bengaluru has become one of the fastest-growing residential centers, enticing developers and homebuyers. Large township developments, such as those by Bharatiya Nikoo Homes, L&T Raintree Boulevard, and others, plus planned developments by Grade A developers, including Manyata, Hiranandani, and others, provide support. The area also benefits from strong social infrastructure, including well-known educational institutions, flyovers, being close to an international airport, and the future construction of a metro rail system.
The weighted average cost of housing units in Bengaluru grew to INR 5,358 per sq ft in H1 2022, up an estimated 9% year over year. Strong demand and the rising cost of building both justify the increase. Fast stock replenishment has caused the quarters-to-sell (QTS) to drop precipitously to 6, the lowest level since 2013.
Also Read: Ultimate Guide for Bangalore Real Estate Investment
| Parameter | 2021 | 2021 Change (YoY) | H1 2022 | H1 2022 Change (YoY) | Q2 2022 | Q2 2022 Change (QoQ) |
| Launches (housing units) | 30,607 | 54% | 21,223 | 126% | 11,117 | 10% |
| Sales (housing units) | 38,030 | 61% | 26,677 | 135% | 13,014 | -5% |
| The average price in INR/sq m (INR/sq ft) | INR 55,435 (INR 5,150) | 4.4% | INR 56,674 (INR 5,358) | 9% | – | – |
Source: Knight Frank
Chennai Real Estate Market in H1 of 2022
The weighted average price for housing units in Chennai grew to INR 5,358 per sq ft in H1 2022, up an estimated 9% year over year. The city noticed a consistent increase in the number of inquiries and conversions from homebuyers because of the better consumer attitude. The residential market in Chennai has been slowly strengthening since H2 2020, with sales momentum gradually increasing to 6,951 units sold in H1 2021, a 21% rise.
7,570 units were introduced in the first quarter of 2022, which resulted in a 40 percent YoY increase in supply levels. Sales during the time were concentrated in the south and west micro-markets, which together accounted for 93% of all sales. Most prospective homebuyers have continued to show interest in the south micro market areas along the OMR and GST Roads.
In H1 2022, 23 percent of all sales were made on projects with ticket prices exceeding INR 10 million, up from 15 percent in 2021. It is necessary to upgrade the family’s primary dwelling and to meet the needs of those who study and work from home. Homebuyers are now willing to look into houses in outlying areas previously off their radar.
Sales were up 5% in the first half of 2022 in Chennai’s residential real estate market, while prices increased by 5% year over year. According to the most recent information from the city’s Real Estate Institute, QTS has slightly grown YoY as launches have outpaced demand (RHI). In Chennai, the average age of inventory has decreased from 16.5 quarters to 12.6 quarters since the same time last year.
Low loan interest rates and the pandemic’s fading threat have helped to create a favorable environment for homeowners. These elements are anticipated to assist the residential sector in continuing its rate of growth in the upcoming quarter.
Also Read: Ultimate Guide on Chennai Real Estate Investment
| Parameter | 2021 | 2021 Change (YoY) | H1 2022 | H1 2022 Change (YoY) | Q2 2022 | Q2 2022 Change (QoQ) |
| Launches (housing units) | 12,783 | 77% | 7,570 | 40% | 3,850 | 3% |
| Sales (housing units) | 11,958 | 38% | 6,951 | 21% | 3,575 | 6% |
| The average price in INR/sq m (INR/sq ft) | INR 43,594 (INR 4,050) | 6.7% | INR 45,661 (INR 4,242) | 4.7% | – | – |
Source: Knight Frank
There has been a significant change in demand for ticket sizes above Rs 50 lakh due to the desire to upgrade lifestyle, meet education and work from home requirements. Despite pandemic-related disruptions in 2020, Hyderabad is the only city that witnessed consistent price increases. It revealed the home market’s fundamental strength.
While it is no longer one of the country’s cheapest markets, it remains a popular location for end-users and investors. Despite worries about overbuilding and the associated overburdening of infrastructure because of the relaxation of FSI restrictions, the mood in the residential market remains upbeat, with mid-tier developments projected to fuel sales momentum in the city.
Do you want to start investing in Indian real estate? Assetmonk is India’s fastest-growing wealth tech platform, providing commercial real estate investment opportunities. We give investment possibilities in emerging markets after doing an extensive due investigation. The IRRs vary from 14 to 21%. Assetmonk offers investors fractional ownership and real estate crowdfunding alternatives for commercial office property.